Mapping experiment 5 – my final map

For my fifth and final mapping experiment, I will be mapping the journey my dog takes through the bushland surrounding my house. To do this, I will be using my iPhone (with GPS fitness running applications), attached to my dog’s harness. The app will track his every movement as we walk through the fire trails.

IMG_6943IMG_7018

 IMG_6931

 A GPS is a Global Positioning System which is a space-based satellite navigation setup that provides location and time information in all types of weather, anywhere on or near the earth where there is an unobstructed line of sight to four or more GPS satellite’s.

IMG_6927

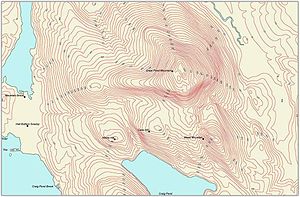
I was able to strap my iPhone which was in a waterproof case, to my dog’s harness using masking tape. The GPS application called Map My Run was used for this experiment. After using this app, i found it was not a satellite view, only street directory map which didn’t show the real images of our surroundings. The next day, i went back over the experiment using a different app called SportsTracker which accurately displayed the environment around us with a red line marking out exactly where my dog has ventured (8.4km).

Sports-Tracker

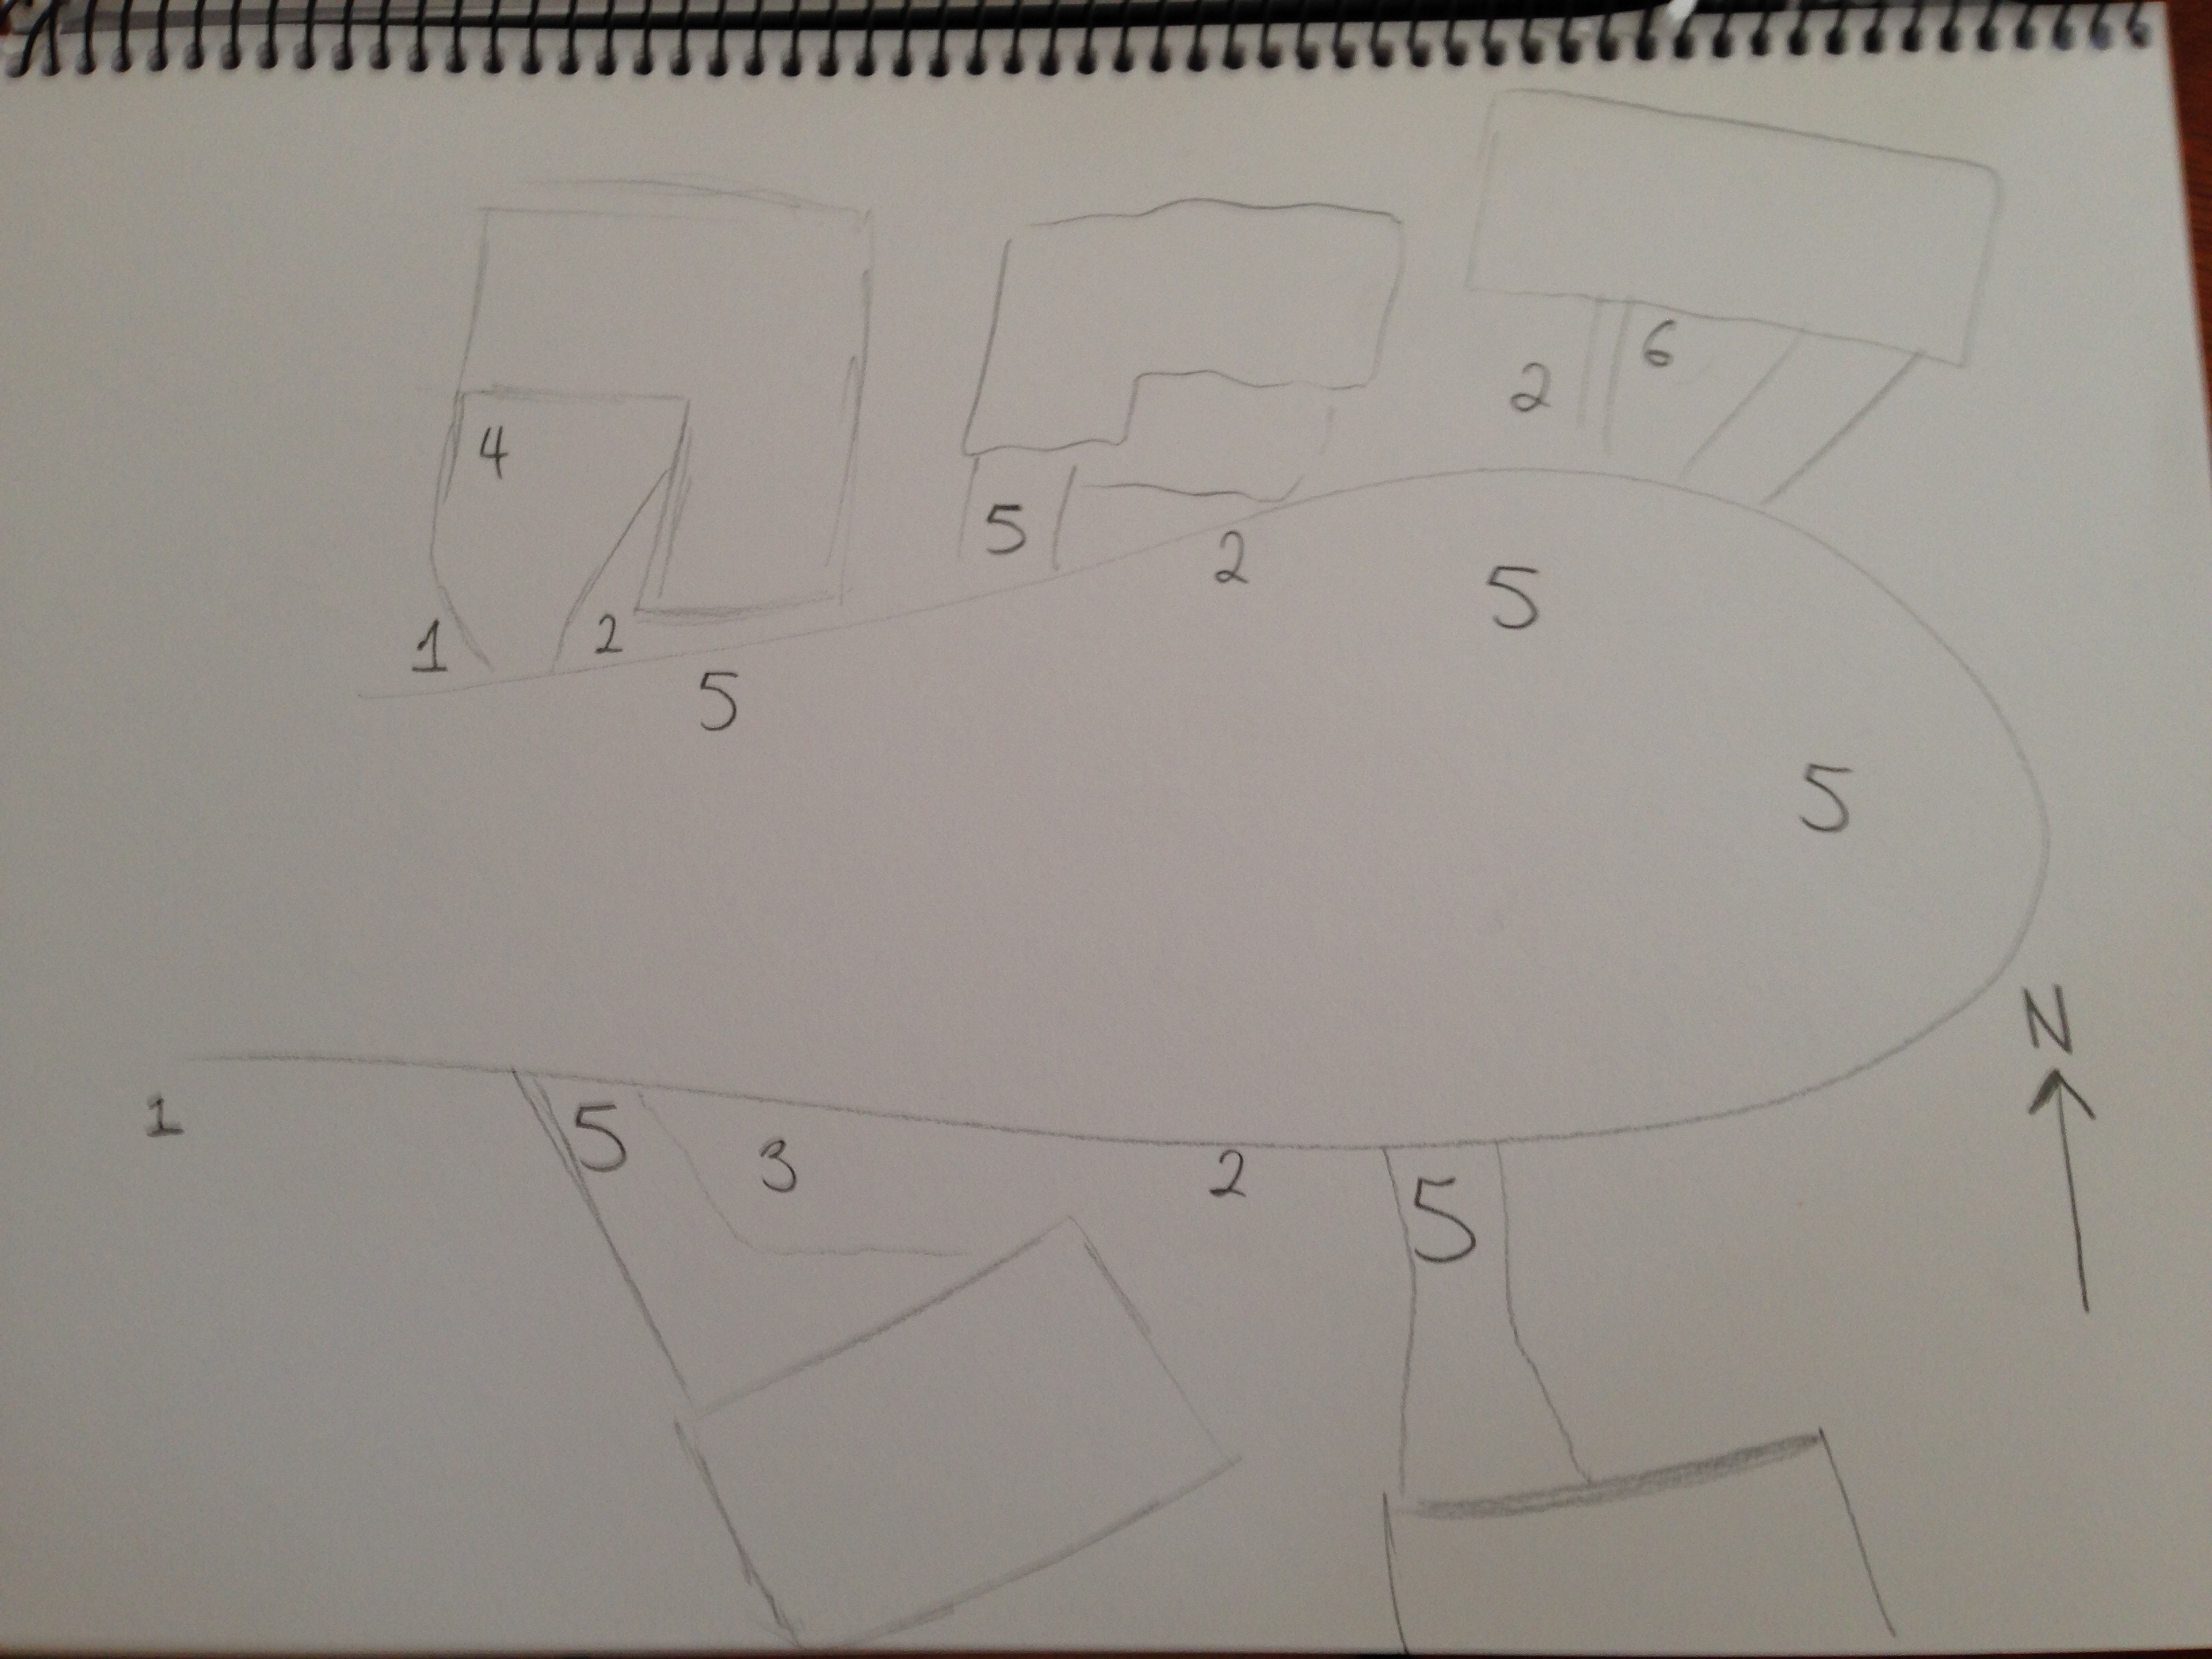
To create a digital A1 size map using Photoshop, I had to create a custom page with the dimensions 594mm X 841mm

Cropped screen shot

Next I made separate layers, and in each layer I used the brush tool in varying shades of green, brown, blue etc. – the main colours of the bushland. I also used different shaped brush tools to try and get a nice background to build on.

Finished A1 Map

Above is the .pdf link to my final map – a visual representation of GPS tracking software showing the spontaneous journey my dog went on in the bush. I used a leaf pattern to represent his path; and it is interesting to see just how much more running my dog did than I. If I were to track the path I went on in the same area, there would be a lot more straight lines and less zig-zagging around. The points where his path abruptly changes direction is an indicator of when he sensed new information, such as birds, insects, and other people/dogs we came across.

If I had more time to practice with photoshop, I would have liked to map elevation,  and distance/time. This would have looked interesting as a 3D map to show the high and low points of the bush, as the area we journeyed through is situated in a valley.

I believe this map would give new insights to someone who isn’t familiar with the sporadic nature of a dog exploring the wild, however, I did not learn anything new from this map as I am quite used to taking him for walks there.

Experiment 4 – Mapping a garden space

For my fourth experiment I chose to map the garden bed and rock pool in my backyard. My aim was to map the different plants, animals and insects that live in the environment.

IMG_9487

I sketched out the area and made symbols to represent different points of interest, which resulted in the following:

done

The next step in the process was to create a key/legend, to match the symbols with their corresponding feature:

legend

All in all, this was a simple experiment in mapping, similar to what I have done on the ‘noticing walk’ and mapping social interactions in my neighbourhood.

Ideas for my final map – experiments with GPS and iPhone technology

For my final mapping experiment, I am considering using GPS technology to track a route I walk in the bushland near my house. The area is quite large, with fire trail access roads connecting the suburbs of Engadine, Woronora, Woronora Heights, Yarrawarrah and Loftus.

In order to accurately record the path I walk, I plan to use free iPhone software that can track GPS location. This app – called Map My Run, is free to download, and can record your route via GPS and maps.

mapmyrun

Image taken from here.

If I can somehow attach my iPhone to my dog’s harness, I can take him with me in the bush and let the app record his movements.

This would provide me with a much more interesting map, as my dog tends to run everywhere, straying off the path and exploring every chance he gets.

I tested the app in my backyard, following my dog as he ran around chasing a soccer ball.

FullSizeRender (2)

The app worked as promised. However, due to the small size of my backyard, the red lines are very condensed, and it is difficult to see the exact route. By doing this in the bush, I will have a much bigger area to work with, which will hopefully lead to a better result.

As this is for my final map, I plan on using a satellite image of the area, with the route we walk placed on top. I think I will create a digital A1 sized map, which means I need to brush up on my skills with Illustrator.

Experiment 3 – Mapping Social Interactions

Following on from the ‘noticing walk’ workshop we did at the start of the session, I wanted to map the social interactions of my neighbours at home. I live in a cul-de-sac, which is quieter than some of the busy main roads in my area. I think that, due to the low amount of traffic in my street, there will be an increased amount of social interactions compared to if I were to map out a busy main road or highway.

To start off, I grabbed a satellite image of my street that I can use as a guide to draw my map:

Screen Shot 2015-03-30 at 11.37.47 am

Then I sat on my balcony and observed at different times of day. In total, I ended up doing three 15 minute observations.

As I did in the workshop, I allocated each interaction a number, and plotted them on my hand-drawn map. They were as follows:

  1. Children playing games
  2. Neighbours talking
  3. Magpies searching for food
  4. Cat sleeping in the sun
  5. Cars coming and going
  6. People door-knocking

FullSizeRender FullSizeRender (1)

It was an interesting experiment. I don’t think there would have been as many interactions taking place if I had done this observation on a main road or similar. The quiet nature of my cul-de-sac tends to lead to more conversations, children playing etc. I do not think I can use this type of mapping technique in creating my final map.

Mapping Workshop – Noticing Walk

In this workshop we took a walk around the UOW campus and Botanic Garden. The objective of this walk was to notice social interactions that were taking place around us as we walked.

Some of the social interactions I noticed during the walk were:

  • people walking
  • lollipop ladies patrolling the pedestrian crossings
  • families with prams
  • birds and insects
  • people talking on the phone
  • people having conversations
  • students yelling ‘stop’ and ‘go’ as we progressed on our walk
  • people smoking

I drew up a map of the route we walked on, and allocated each event I saw a letter of the alphabet in the key, to make it easier to see what was happening and where.

IMG_9404

I tried to take this further by creating a stencil cut-out of the botanic gardens, however the lesson ended before I had a chance to finish this part (see below). It would have looked pretty good as a final product.

IMG_9405

This was an interesting workshop. I never usually pay attention to what is happening around me like I did during this walk, so it was good to gain some new insights into social interactions that take place when you are completely silent.

Experiment 2 [PART B] – Creating Topographic Maps

Based on the research done in part A, I have decided that my next mapping experiment will involve the use of contour lines to illustrate how they can be used to show not only geographic features, but also features of the human body. To do this I will be creating a to-scale topographic map of my foot.

Using a stencil knife on this self-healing mat, I cut the different sizes and shapes that were required from black cardboard. Once I had all the pieces I splayed them out across the mat to get an idea of what my map would look like in 2D, before I pieced them together to form the 3-dimensional final product.

IMG_9479

This is what I ended up with. All that was left to do was to stack each piece on top of one-another until I had a topographic interpretation of my foot.

IMG_9481IMG_9480

All in all I’m quite pleased with how this experiment turned out. It was a simple but entertaining experiment, and I feel that the final product is an adequate representation of how topography can be used to turn a two-dimensional image into a 3D one. However, I don’t think that I will continue with topography or contour lines in creating my final map.

Experiment 2 [PART A] – Researching Topographic maps

Topography is a field of geoscience and planetary science that focuses on studying the surface shape and features of the Earth, and other planets, moons and asteroids. Topography means the description of shape, so when you talk of the topography of the land, you are referring to landscape features including valleys, hills, mountains, lakes, rivers, or the coastline. Any descriptive information about the lay of the land, is part of the topography of that area. Contour lines are used in topographic maps to show elevation and shape of terrain. They are the most distinguishing feature of a topographic map – and connect points of equal elevation. There are three different types of contour lines:

  • Index contour – every fifth line is an index contour. These display the elevation of a line, in order to keep the map simple.
  • Contour line – lines drawn on a map connecting equal points of elevation.
  • Contour interval – in order for a map to be simple and easily read, these show lines for certain elevations only

how-to-read-topographic-map-2

Image taken from here

300px-Cntr-map-1

An example of contour lines showing topography taken from here

Experiment 1 – Ways of Seeing

One of the workshops we did was to map different ways of seeing. The instructions were to:

‘Select one animate thing in the courtyard garden (human, animal, insect, object). Follow it for fifteen minutes and trace its movements’.

I decided to try it at home, mapping the path that a colony of ants would take in my backyard.

I started by laying a blank sheet of paper down on the ground, and traced the path which the ants took with coloured pencils, so as to easily distinguish one ant’s journey from another. I had to let the paper sit for about 5-10 minutes until there was enough ants moving around on top. Unfortunately, ants don’t like being chased by a giant with a pencil as they forage for food and explore. This meant I had to think of ways to coax them back onto the paper, so that my experiment could continue.

What food to use? I gathered a few bits and pieces of the first things I could see in the kitchen, which consisted of:

  • Potato chips
  • Sugar
  • Cinnamon
  • Wholemeal bread
  • Strawberry jam
  • Cucumber

Once I had the food, I placed it in arbitrary points on the pieces of paper. I tried to scatter it around a bit to encourage more movement.

The results were varied and provided some very interesting insights into what ants will and won’t touch. My findings were as follows:

00001

The piece of paper that had sweeter bits of food – chips, sugar, jam – were covered in ants. This was clearly the most popular choice for the ants – I could barely keep up with tracing their paths. This resulted in using the same coloured pencil multiple times, so that I could manage to at least record where they were going. I didn’t have enough time (or hands) to keep switching pencils for every ant.

00002

The bread was also well-liked, although not as much as the chips, jam etc. I hypothesise that ants have a bit of a ‘sweet tooth’, and are generally more inclined to go after sweeter food over plain bread.

00003

The pieces of paper that had cinnamon and cucumber were left completely alone, except for one or two ants doing some reconnaissance  to see whether there was a suitable meal available . A quick search on google revealed that ants are typically deterred by these foods, which makes them useful for keeping these insects out of areas you don’t want them to be in around the home (the website suggested diluting cucumber juice in a spray bottle with water and spraying it around the garden).

  • What’s interesting in the paths they take is that you can clearly see where they decide to stop and change direction – these ants are quite erratic/unpredictable in their movements.

By mapping the unseen, I learned some new things about the behaviour and diet of the ants that live in my backyard. It was a very interesting experiment to see which types of food generated the most foot traffic. By recording their pathways I gained new insights into something I was not aware of before. I am interested in taking this a step further towards my final map. It will probably involve using animals and mapping their path in a particular environment.

Mapping Workshop – Mapping Place Through Story

In this experiment, we were tasked with mapping a place in the book “Oh The Places You’ll Go” by Dr. Seuss

OHThePlacesYoullGo978-0-679-80527-4-590x487

Image sourced from here

I chose to map out the ‘waiting place’ (pictured below)

‘for people just waiting.

Waiting for a train to go

or a bus to come, or a plane to go

or the mail to come, or the rain to go

or the phone to ring, or the snow to snow

or waiting around for a Yes or No

Everyone is just waiting.’

The repetition of the rhyme suggests that the waiting place is stagnate, an environment where you don’t progress or grow at all, everything stays the same.

The-Waiting-Place

Image sourced from here

As can be seen in the pdf’s below (Waiting 1-6); I attempted to create a visual representation (word map) of the waiting place using adobe illustrator. In order to map the endless waiting described in the book, I used the word ‘waiting….’ and shaped it to wrap around a circle. Then copied and pasted the same text until it had no observable beginning or end. I decided on a black and white colour scheme, to try and emphasise the monotony of the waiting place. By experimenting with the same font in different sizes, and by using smaller circles within circles, I tried to convey the idea that the waiting place is never-ending. It goes on forever.

Waiting1

Waiting 2

Waiting 3

Waiting 4

Waiting 5

Waiting 6

All in all this was an interesting activity, and I learned some new skills with Illustrator. However, I don’t feel as though this is a direction I will pursue in creating my final map. I would prefer to work with nature and map something that is spontaneous.