Following on from the ‘noticing walk’ workshop we did at the start of the session, I wanted to map the social interactions of my neighbours at home. I live in a cul-de-sac, which is quieter than some of the busy main roads in my area. I think that, due to the low amount of traffic in my street, there will be an increased amount of social interactions compared to if I were to map out a busy main road or highway.
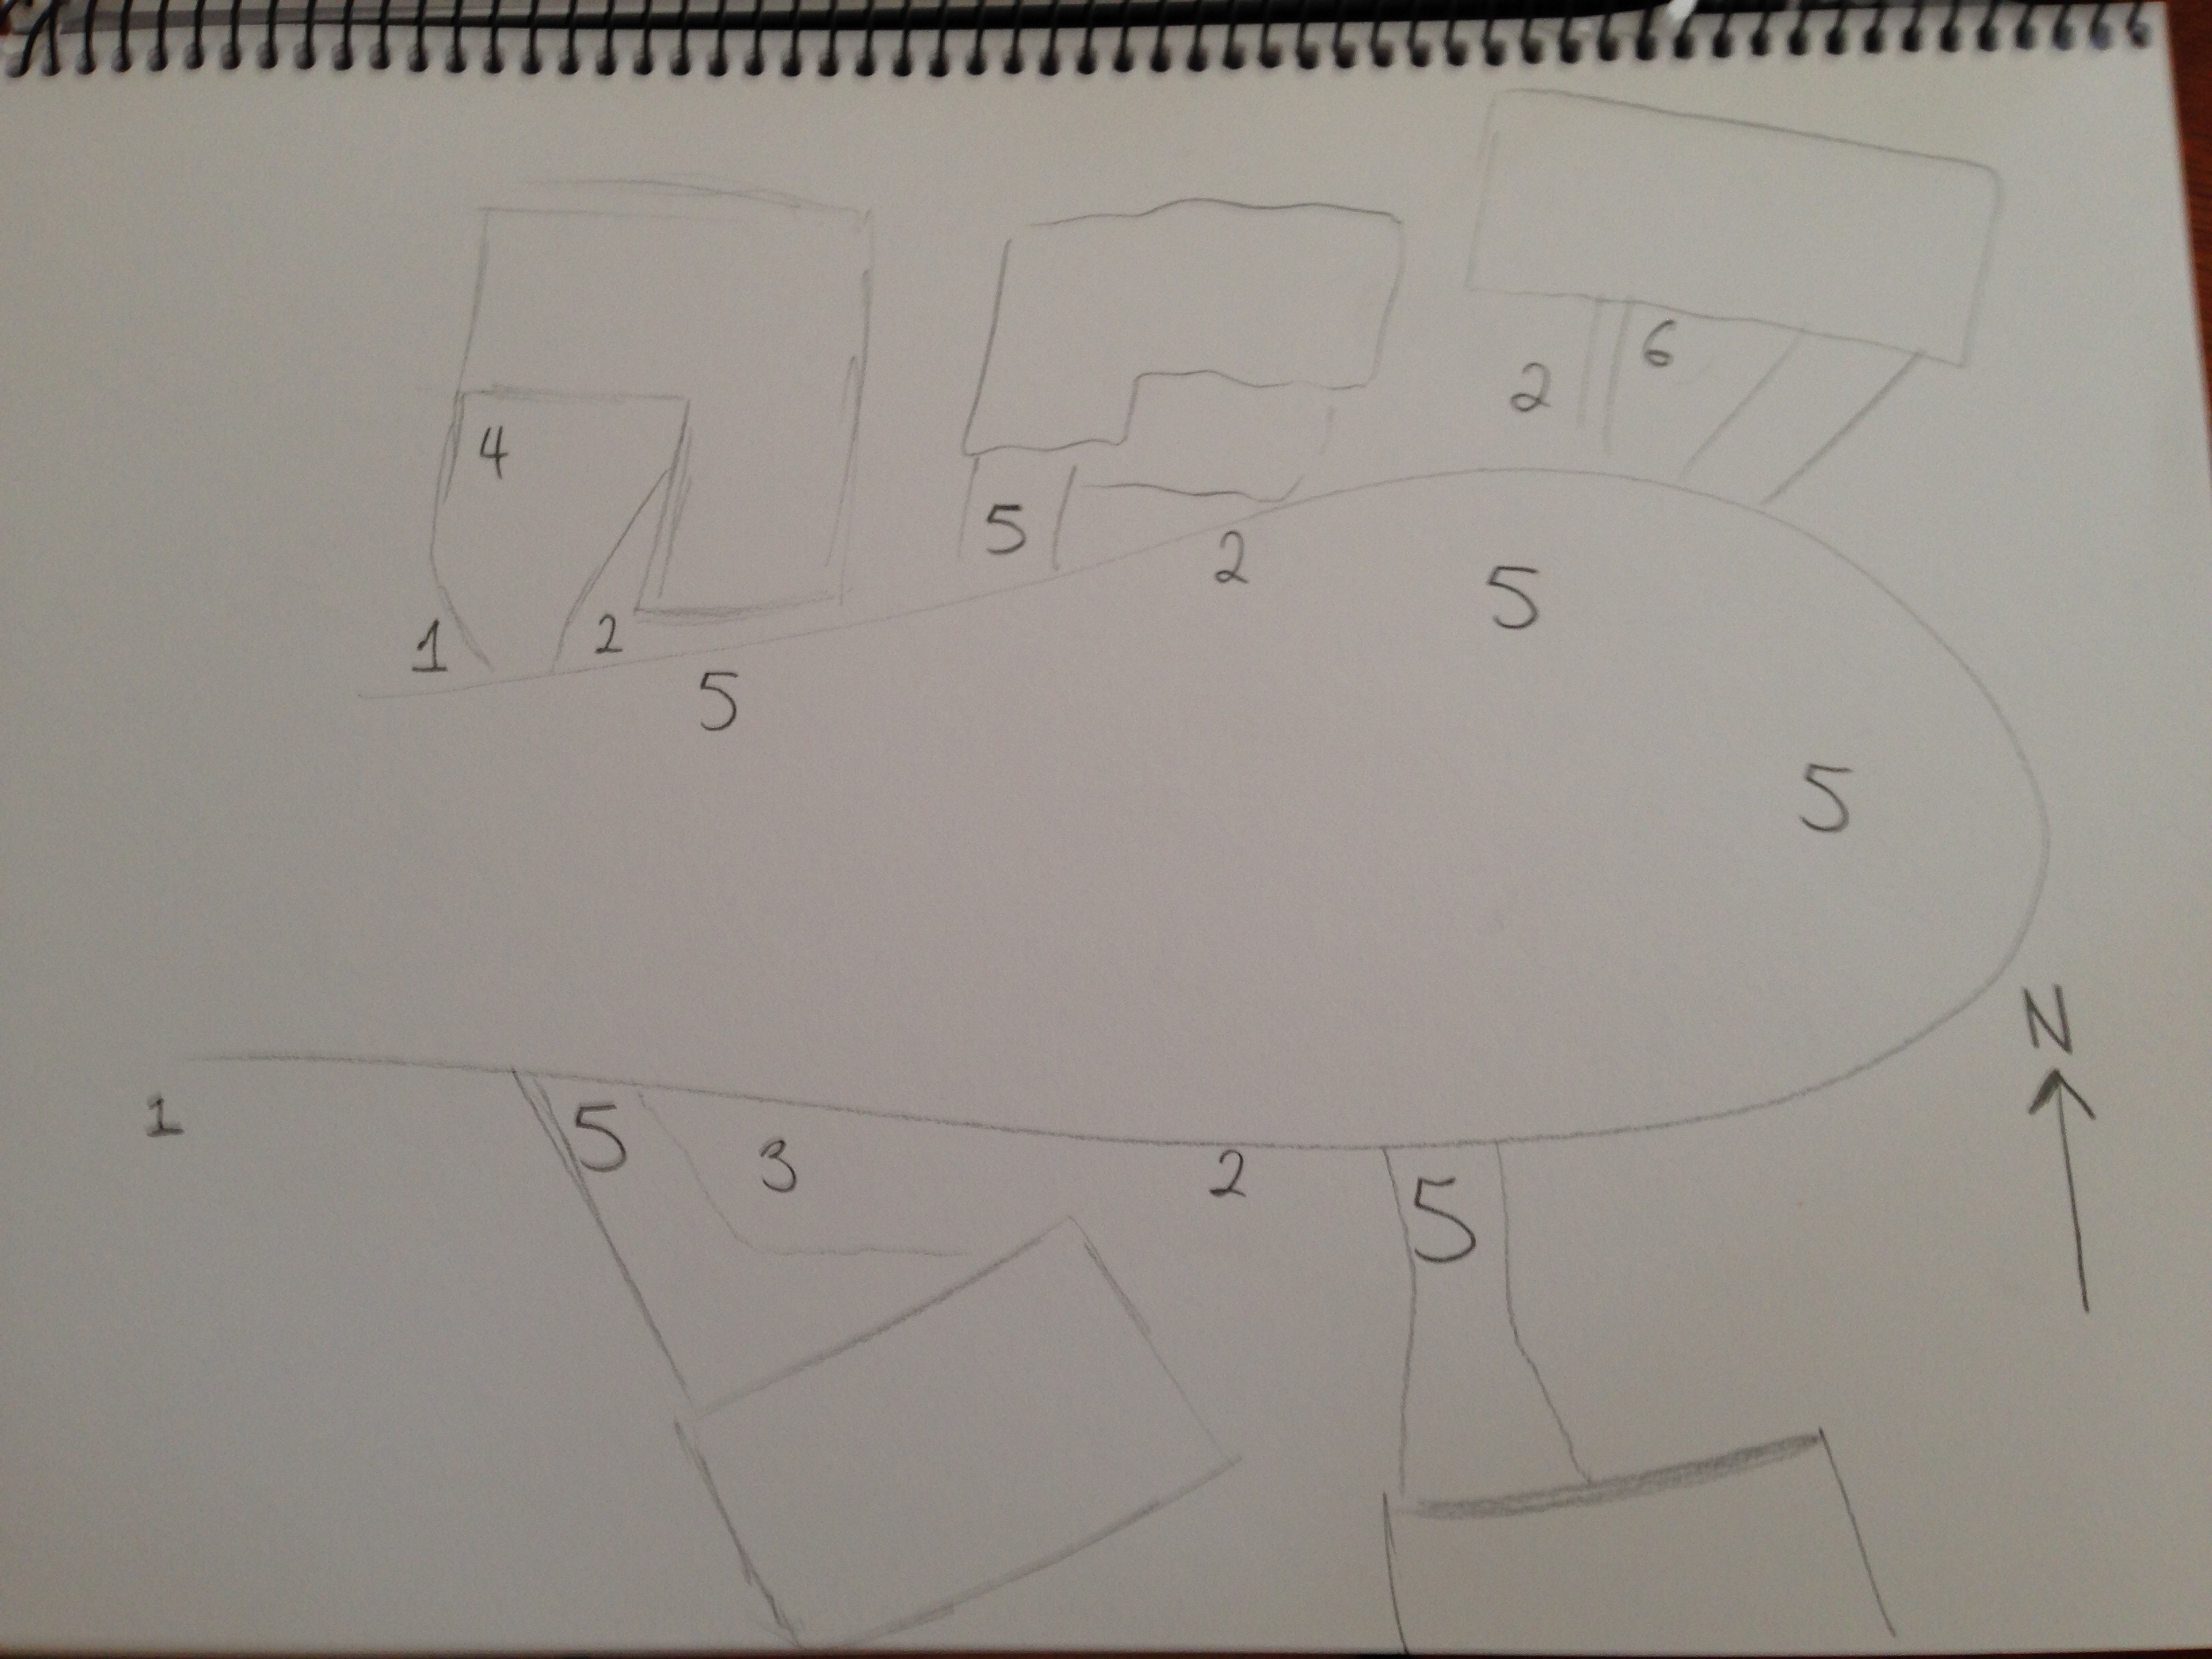
To start off, I grabbed a satellite image of my street that I can use as a guide to draw my map:

Then I sat on my balcony and observed at different times of day. In total, I ended up doing three 15 minute observations.
As I did in the workshop, I allocated each interaction a number, and plotted them on my hand-drawn map. They were as follows:
- Children playing games
- Neighbours talking
- Magpies searching for food
- Cat sleeping in the sun
- Cars coming and going
- People door-knocking

It was an interesting experiment. I don’t think there would have been as many interactions taking place if I had done this observation on a main road or similar. The quiet nature of my cul-de-sac tends to lead to more conversations, children playing etc. I do not think I can use this type of mapping technique in creating my final map.
